Updated
Two-day water level charts, rate of rise and time to the bank
Every gauging station on the map now has a chart of its last two days of water level with the bank marked, so you can see at once whether the water is rising or falling, how fast, and how far it is from the bank. The stats page gathers the charts for the places people follow most and the stations over the bank.
See the stats page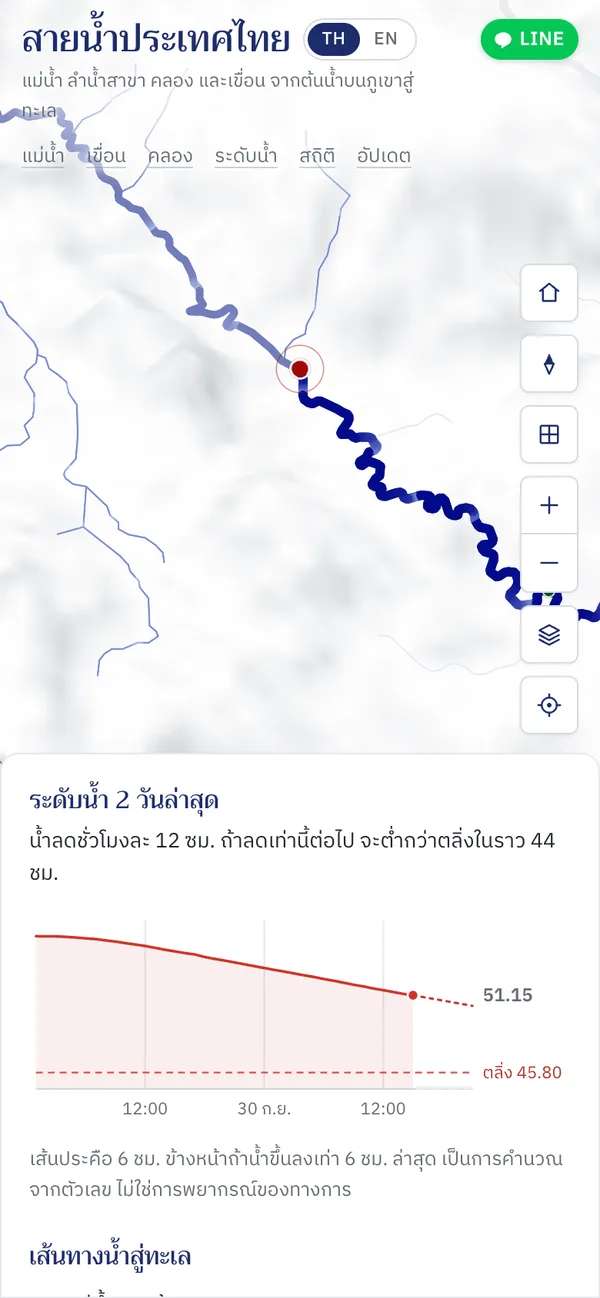
How to use it
Tap a gauging station
The coloured dots on the rivers are water level stations, coloured by their situation now. Tap one to open its panel.
Read the two-day chart
The solid line is the water level and the red dashed line the bank. The dot at the end is the latest reading; gaps are hours the station sent nothing.
Read the trend
The line above the chart says how many centimetres the water rose or fell over the last 6 hours and, if it keeps going, when it would reach or drop below the bank. Where the water rises and falls in turns, as near the sea with the tide, it says how far it swings and which way it is going now instead. The dotted run-on is the next 6 hours if nothing changes.
See what people follow
Open Stats for the charts of the places opened most in the last 24 hours, the stations over the bank, and how the LINE bot is used.
Good to know
- The 6-hour trend
- Worked out from the last 6 hours of readings with the straight line that fits them best. Under 3 cm either way reads as little change, and when those hours have too few readings, none is shown.
- Not a forecast
- The time to the bank and the dotted line are arithmetic at an unchanged rate. Rain, dam releases and high tides can change the trend at any time; follow the Royal Irrigation Department and local authorities.
- Days until a dam is full
- Today's inflow minus today's release, set against the room left up to normal storage.
Where the data comes from
Water levels come from the National Hydroinformatics Data Center (ThaiWater): each station's graph and the readings this site saves every 10 minutes. Dam figures are daily data from the same source.
Frequently asked questions
- Is the dotted line a forecast?
- No. It is the next 6 hours if the water keeps rising or falling as it did over the last 6, for a rough direction only.
- Why are there gaps in the chart?
- The station sent nothing for those hours, or the source did not answer in time, so the chart leaves them empty rather than drawing a line across.
- Why do some stations have no bank line?
- When the bank height in the data disagrees with the station's own percentage of bank capacity, the line is left out rather than drawn in the wrong place.