Updated
See rain on a map: 24-hour totals, the last hour and the rain above each dam
The rain layer shows rainfall from more than 4,300 gauges across the country, on the same map as the rivers and dams, in two ways. The 24-hour total shows which basins it fell in over the past day and which dam or river that water will reach; the last hour shows where it is raining now.
Open the map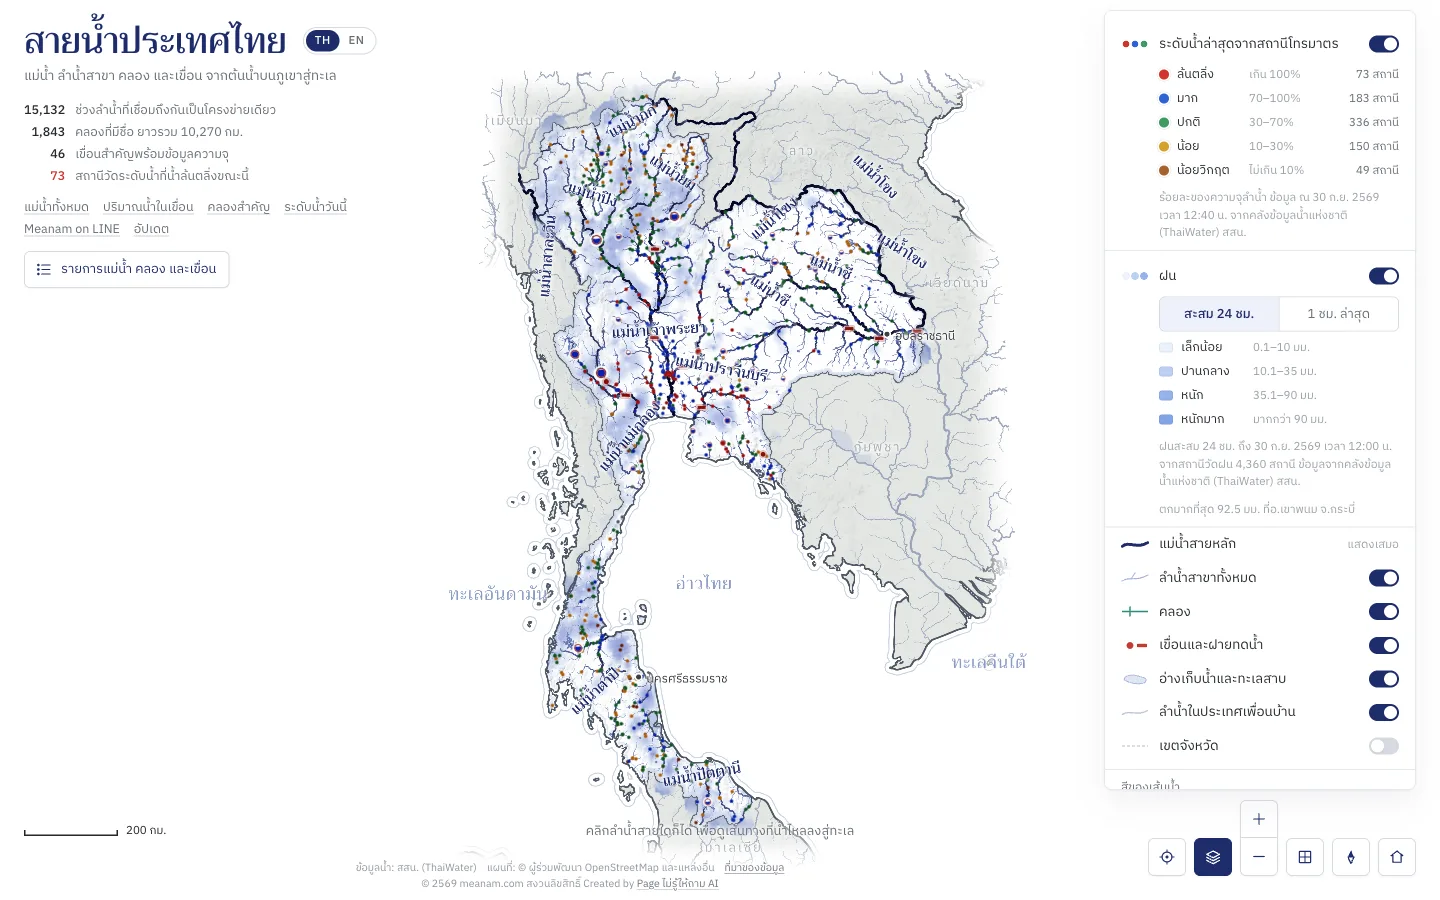
How to use it
Switch the rain layer on
Press the layers button on the map and switch on Rain. The layer is off by default, so the map looks as it always did until you turn it on.
Choose the period
24-hour total is all the rain of the past 24 hours, the one to read for how much water will run into rivers and dams. Last hour is the rain in the latest hour the gauges reported, close to what is falling now.
See where it rained
Blue marks where it rained, deeper for more. White means no rain, or no gauge nearby. Zoom in for district detail.
See the rain above a dam or river
Tap a dam, a river or any point on one. The panel adds a line with the average 24-hour rain over the whole catchment above it and the volume of rain in million cubic metres.
Good to know
- Colours follow the Meteorological Department
- Over 24 hours: light 0.1–10 mm, moderate 10.1–35 mm, heavy 35.1–90 mm and very heavy above 90 mm. In the last hour: light up to 5 mm, moderate 5.1–25 mm, heavy 25.1–50 mm and very heavy above 50 mm. The same colour means the same class in both.
- Average rain above a dam
- The mean 24-hour rain over the whole catchment that drains into the dam, not the rain at the dam itself. The volume is that mean times the catchment area; only part of it reaches the reservoir, the rest soaks in or evaporates.
Where the data comes from
Rainfall comes from the National Hydroinformatics Data Center (ThaiWater) of the Hydro-Informatics Institute, which gathers gauges from several agencies including the Department of Water Resources, the Royal Irrigation Department, the Meteorological Department and EGAT. It is fetched every 10 minutes and spread onto a 5 km grid from the nearest gauges.
Frequently asked questions
- Why does a radar site show no rain where this map does?
- Rain radar shows the rain falling at that moment. The 24-hour total shows all the rain of the past 24 hours, so places stay coloured after the rain has stopped. To see where it is raining now, choose Last hour, which is close to radar, though it comes from gauges on the ground, so rain that falls away from a gauge does not show.
- Which 24 hours does the total cover?
- The 24 hours up to each gauge's latest report. The time of the data is under the legend in the layers menu.
- Is the last hour the rain right now?
- Close, but not to the minute. It is the rain in the latest hour the gauges reported, which can run a little behind. The time of the data is under the legend in the layers menu.
- Why do some areas have no colour?
- Either it did not rain, or there is no gauge within 30 km, which is common in forested mountains and outside Thailand.
- Why is there no rain figure for some dams or rivers?
- When most of the catchment lies outside Thailand, as on the Mekong and the Salween, there are no gauges in the data, so no figure is given rather than a misleading one.