Updated
Look up water levels by station across Thailand, with two-day trends
The water levels page gathers the latest readings from telemetry stations across the country. Now you can type to find the station you follow, and every station on the page opens its last two days of water level and its trend in place, without opening the map.
Open water levels today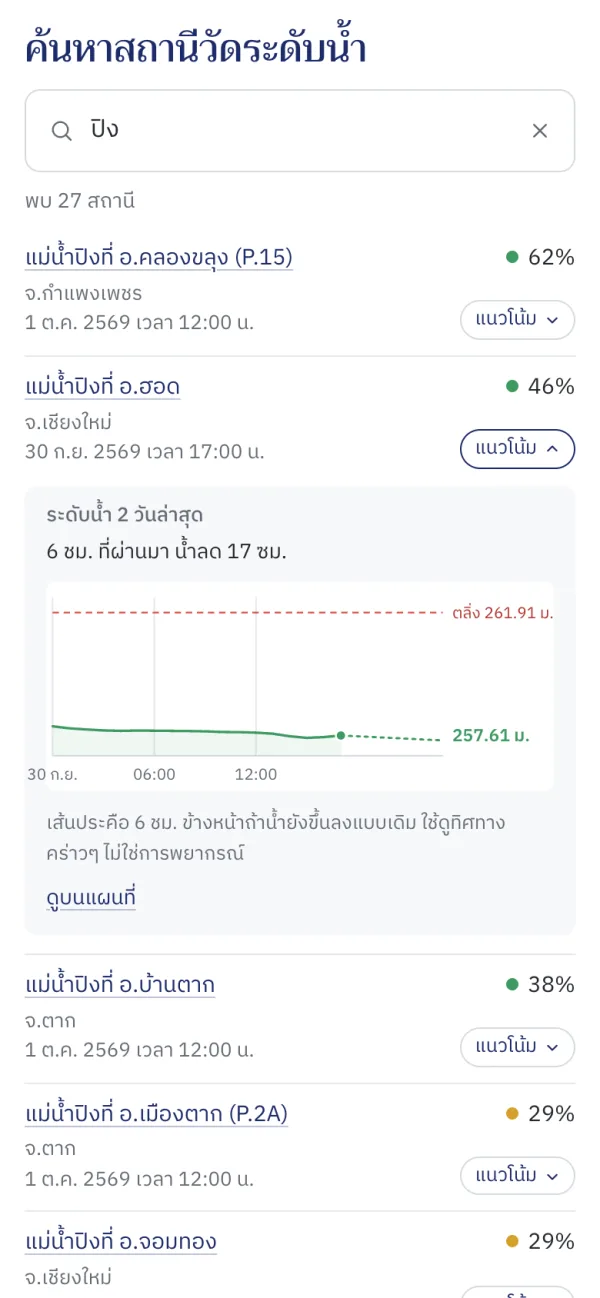
How to use it
Find a station
Type in the station search: a station's name, a river, a district or a province, such as Ping or Chiang Mai, in Thai or English. Stations whose names match come first, then the fullest.
Open the trend
Press Trend at the end of a row and the last two days open beneath it. The red dashed line is the bank, and the line above the chart says how far the water rose or fell over the last 6 hours. Press again to close it.
Watch the stations that matter
The charts at the top are the stations where the water is highest against the bank right now, and every row in the tables of stations over the bank and with high water opens its trend too.
See it on the map
Press Open on the map under the chart to find the station on the 3D map and see where its water flows.
Good to know
- Against the bank
- The percentage is the water level against the station's bank: above 100% the river is over its bank. The colours run from critically low to over the bank.
- Not a forecast
- The trend and the dotted line come from the last 6 hours of readings at an unchanged rate. Rain, dam releases and high tides can change it at any time.
Where the data comes from
Water levels come from the National Hydroinformatics Data Center (ThaiWater), refreshed every 10 minutes; the charts come from each station's graph in the same system.
Frequently asked questions
- Can I search by province?
- Yes. Type a province or district for every station there, fullest first. Past 30 results, type more to narrow them down.
- Why does a station have no chart?
- Some stations have no history at the source, or the source did not answer in time. Try again a little later.