Updated
Water along a river: every station on one chart, and dam storage against last year
When the water is high, what matters is the whole river: where it is near the bank, and where it is already over. Click a river on the map and its panel lines up every station on it, from upstream down, in one chart; click a dam to see whether its reservoir holds more or less than this time last year.
Open the map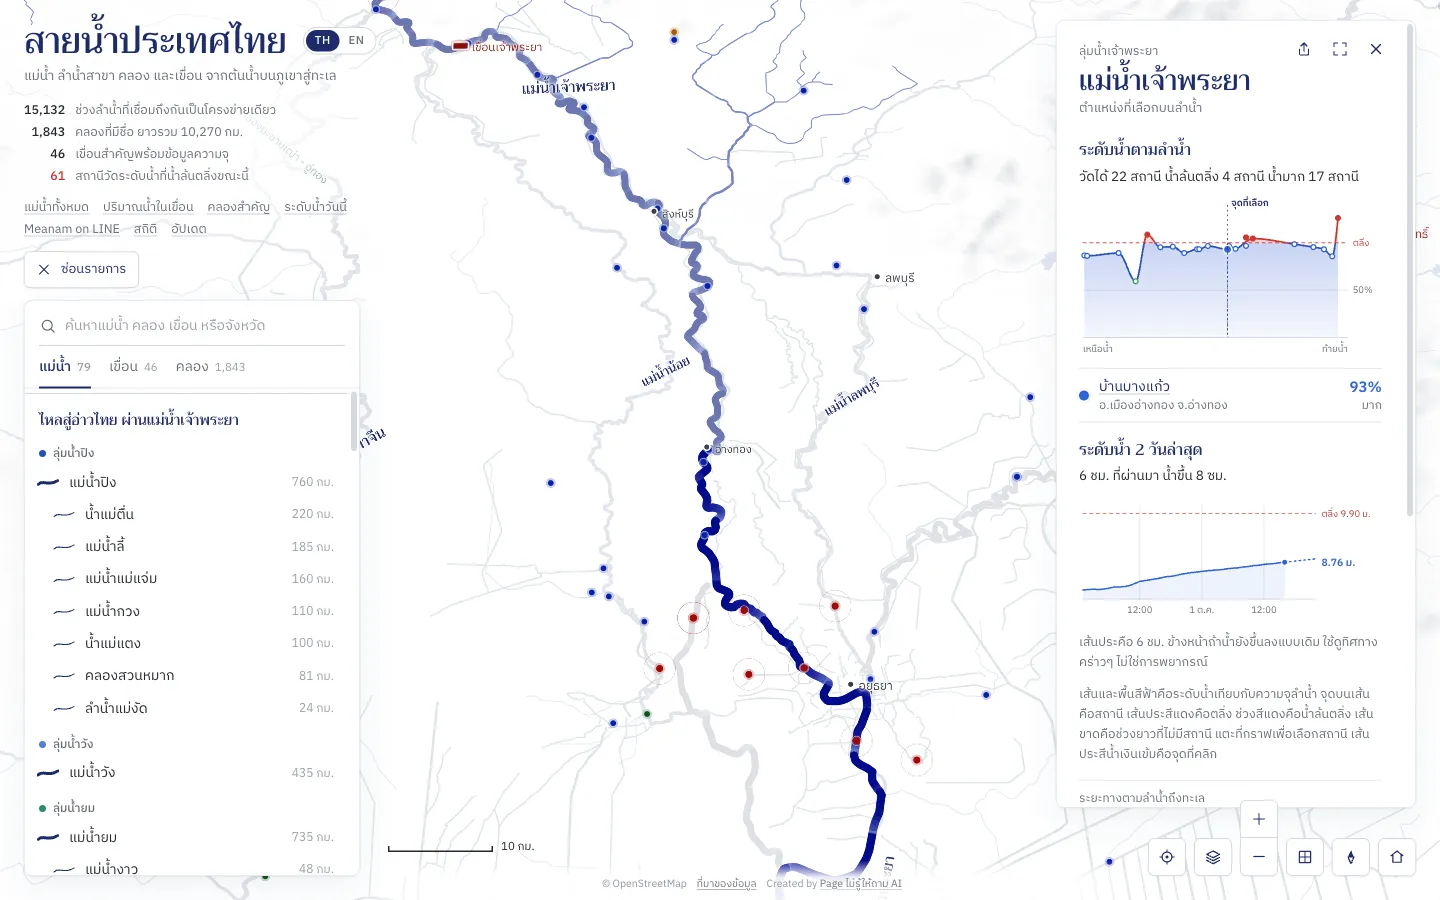
How to use it
Click a river
Click a river line on the map, or pick a river from the list on the left. Its panel shows Water along the river; when you click on the map, a dark dotted line marks the spot.
Read the chart
The blue line, with the water beneath it, is the water against bank-full, run through every station by its distance down the river; each dot is a station, coloured as on the map. The red dashed line is the bank, red stretches are over it, and a break in the line is a long stretch with no gauge.
Pick a station
The station nearest the spot you clicked, or the one with the most water, is picked first. Tap the chart near another, or use the arrow keys, and the two-day chart below follows. Press the station's name to open it on the map.
Click a dam
Click a dam on the map. Under today's storage, its panel charts the daily storage since January against last year, with the normal storage and the rule curves, and says how much the water rose or fell over the last 7 days.
Good to know
- Bank-full
- 100% means the water has reached the lowest bank at the gauge, and above 100 it is over the bank. It comes from each station, so upstream and downstream compare fairly even though their levels in metres differ greatly.
- Stations not on the chart
- The chart holds the stations that sit on that river and are reporting. Stations on canals, or without a bank height, are left out. Click a small stream with no name and the panel lists the three nearest stations instead.
- This year against last
- The coloured line is this year and the grey line last year; the red dashed line is the normal storage and the dotted lines the upper and lower rule curves. Above the upper curve a dam usually has to release more.
Where the data comes from
Station water levels from the National Hydroinformatics Data Center (ThaiWater), HII, refreshed every 10 minutes; daily reservoir storage from the series ThaiWater charts on its own dam pages.
Frequently asked questions
- Why is there no chart when I click a river?
- Some rivers have no gauging station reporting yet. On a small stream with no name, the panel lists the three nearest stations instead.
- Why do some dams have no chart of this year against last?
- Only dams whose daily storage ThaiWater keeps have it. Barrages and run-of-river dams hold no storage to chart.