Updated
Reservoir simulator: when a Thai dam would fill, at the inflow, release and rain you set
At the end of the rains the question everyone asks is when a dam will be full and how much it must release. The simulator starts from today's real storage, inflow and release, lets you change them and shows the result on the chart at once. It adds the inflow and takes off the release a day at a time, so you can see where every answer comes from.
Try it on Bhumibol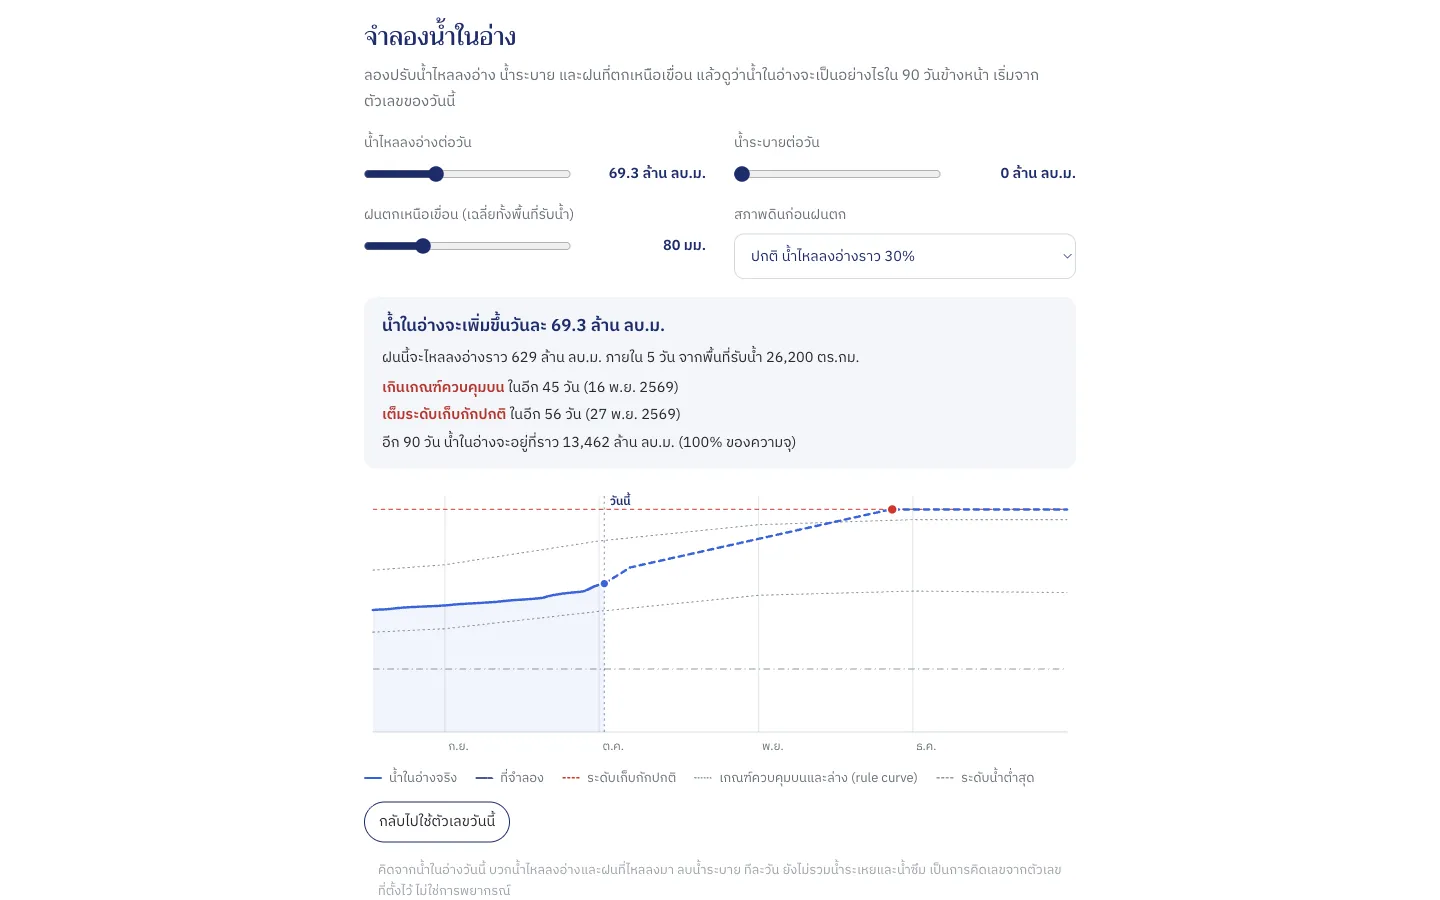
How to use it
Open the simulator
Open a dam's page from Dam storage and scroll to Try the reservoir, or click a dam on the map and press Try the reservoir in its panel.
Set the inflow and the release
The sliders start at today's figures. Lower or raise the release to see how much sooner or later the dam would fill; Back to today's figures starts again.
Add rain over the catchment
Set the average rain over the catchment and how wet the ground was. The water that would run into the reservoir within five days is worked out from that dam's own catchment.
Read the result
The box says how much the reservoir would rise or fall a day, and the days it would reach normal storage, cross the upper or lower rule curve or fall to dead storage. The chart shows the last 45 days and, dashed, the next 90.
Good to know
- How it works
- Tomorrow's storage = today's storage + inflow + the rain that runs in − release, a day at a time. Evaporation and seepage are left out, and the inflow and release stay as you set them.
- How much rain reaches the reservoir
- Not all the rain runs in: some soaks into the ground or evaporates. About 20% runs off dry ground, 30% usually and 50% when the ground is soaked. The catchment is worked out from the map's river network.
- Rule curves
- The range a dam is meant to be kept within through the year. Above the upper curve a dam usually has to release more; below the lower one it holds less than it should for the season.
Where the data comes from
Storage, inflow, release and rule curves from the National Hydroinformatics Data Center (ThaiWater); largest capacity and dead storage from the Royal Irrigation Department.
Frequently asked questions
- Is this a forecast?
- No. It is arithmetic on the figures you set: if the inflow and release were as set, the reservoir would do what you see. For actual releases, follow the Royal Irrigation Department and EGAT.
- Why do some dams have no simulator?
- It needs today's storage, so dams that do not report it daily, such as barrages, have none.